"Show me the house you live in, and I'll tell how many car accidents you're gonna have!" According to a Stanford University research, that sentence actually makes sense.
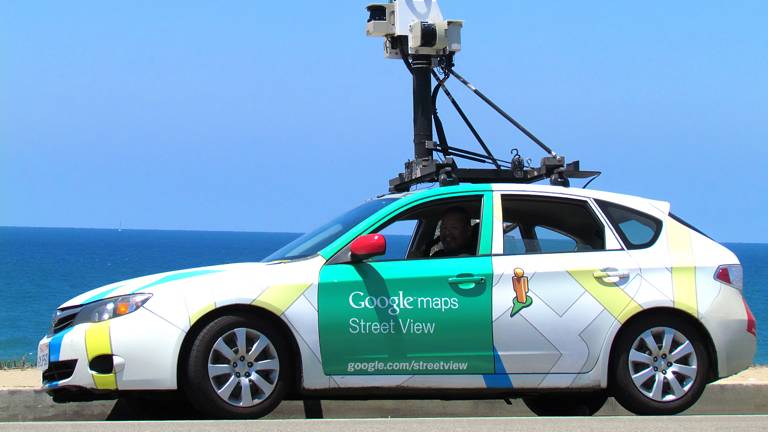
The research was based on the images from Google Street View trying to find a possible correlation between the type of house in which a person lives and the probability that the same person has to be involved in an accident road.
Google Street View theorem
It all started by analyzing the data of 20,000 random clients of an insurance company who had taken out car insurance in Poland. The researchers and their team looked for the home addresses of the clients in Google Street View. They saved a shot of the houses exterior view and classified the images according to the housing type (condominium, independent house, terraced house, etc.), age of the building, and aesthetics & architecture.
Eventually, they matched these data with those provided by the insurance to extrapolate a probable correlation with the likelihood that a policyholder would file a complaint.
The results
The researchers have discovered that the kind of home in which a client lives is a good predictor of the possibility that they will file an insurance claim.
Even knowing the state of the house could increase the probability that an insurance company will be able to identify a customer with a high tendency to submit complaints by 10%.
According to the researchers, the current research is only a "proof". The precision could be enhanced by utilizing a larger amount of data and using a more accurate analysis.
Privacy Issues
Using data such as the aesthetics and architecture of the house where you live - with the current regulations - goes far beyond the borders of the rights an insurance company can have on its clients.
The correlation between home and accidents could open a Pandora's box: More organizations could take advantage of the processed data. For example the insurance sector could be quickly followed by banks since there is a proven correlation between insurance risk models and the credit risk score.
There are also other similar studies
This is not the first time that Google Street View data has been used to extract sensitive and/or confidential information. Two years ago another Stanford research used images from Google Street View to explain how some cities in the United States had voted, starting with photos of parked cars. Thanks to an algorithm, the team was able to grasp the correlation between the types of vehicles and the US Census data resulting in an examination of the votes in the presidential elections in each district of 35 cities.
The question they tried to answer was: Given the arrangement of the vehicles in an area, could the algorithm accurately predict the demographic data recorded in the US Census and the presidential vote data? - The answer was Yes.
In this case, unlike the study that relates housing to car insurance customer profiles, some more details had been provided. For example, sedans were more closely linked with Democrats, while pickups were more "coordinated" with Republican owners.
"We have found that by traveling a city for 15 minutes counting sedans and trucks, it is possible to reliably determine whether the city has voted Democratic or Republican." - Researchers said.
Results that raise questions in both cases about how apparently harmless data-sets can filter personal information and how much organizations should be able to use them. And most importantly, what else can you discover about us using a simple web app or a social network?


